

Engineering FAQ: Measurement Data Problems Solved with UniPlot
Noisy signals, hundreds of test files, reports that take half a day to put together: this FAQ collects the questions engineers ask most often when they work with measurement data, and shows how each one is solved in UniPlot.
Every answer is based on the UniPlot manual. Most of them come with a diagram created in UniPlot from the sample data that ships with the program, so you can reproduce them yourself with the free trial version.
Installation, licences, error messages and other support questions are answered in the FAQ, for example Installation, Updates and Settings, Licensing: Single-User Licences and Startup Problems, Crashes and Error Messages.
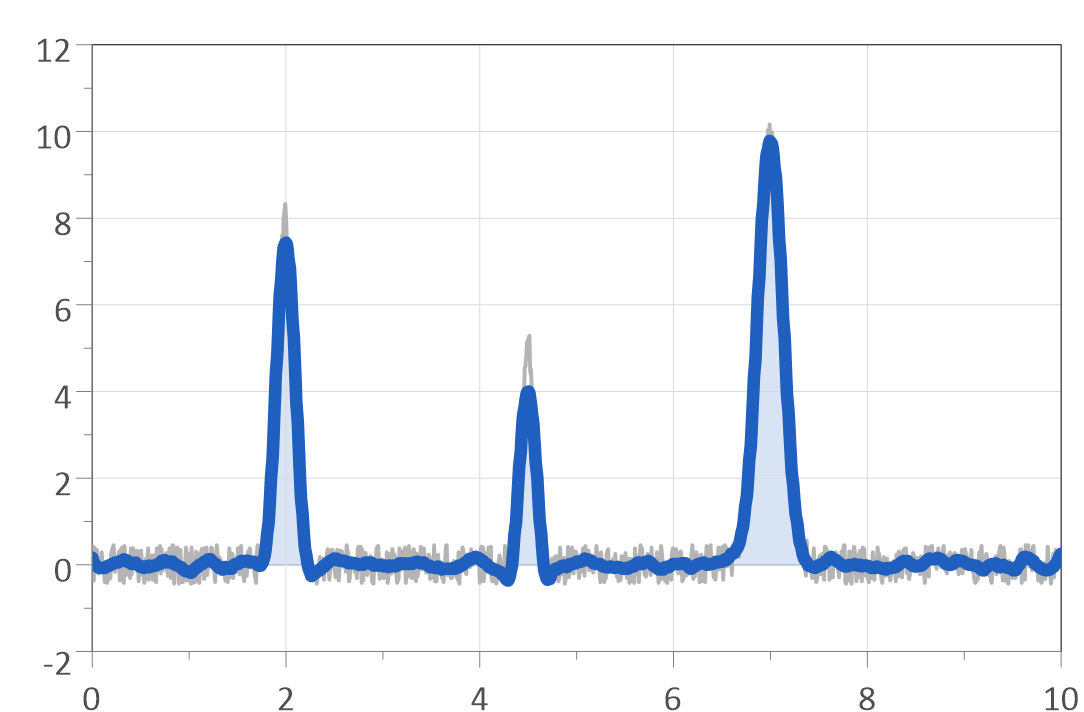
Smooth noisy signals, remove spikes, filter frequencies, calculate spectra, envelopes and histograms.
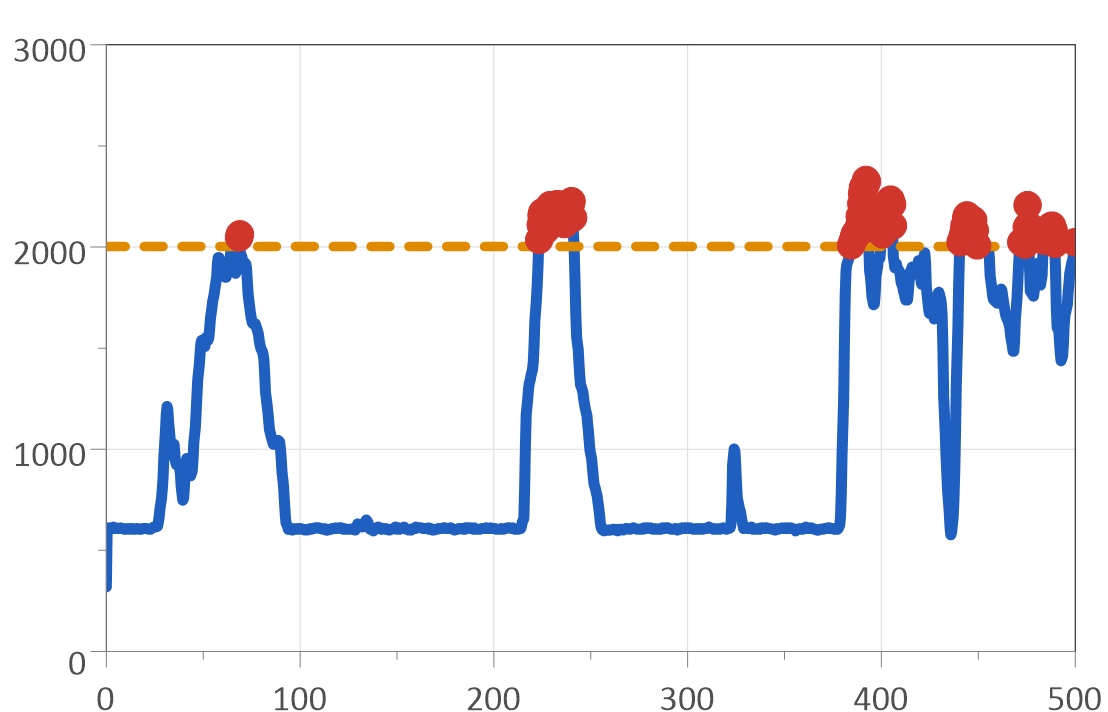
Find limit violations, overshoots, plateaus and the duration of events in long recordings.
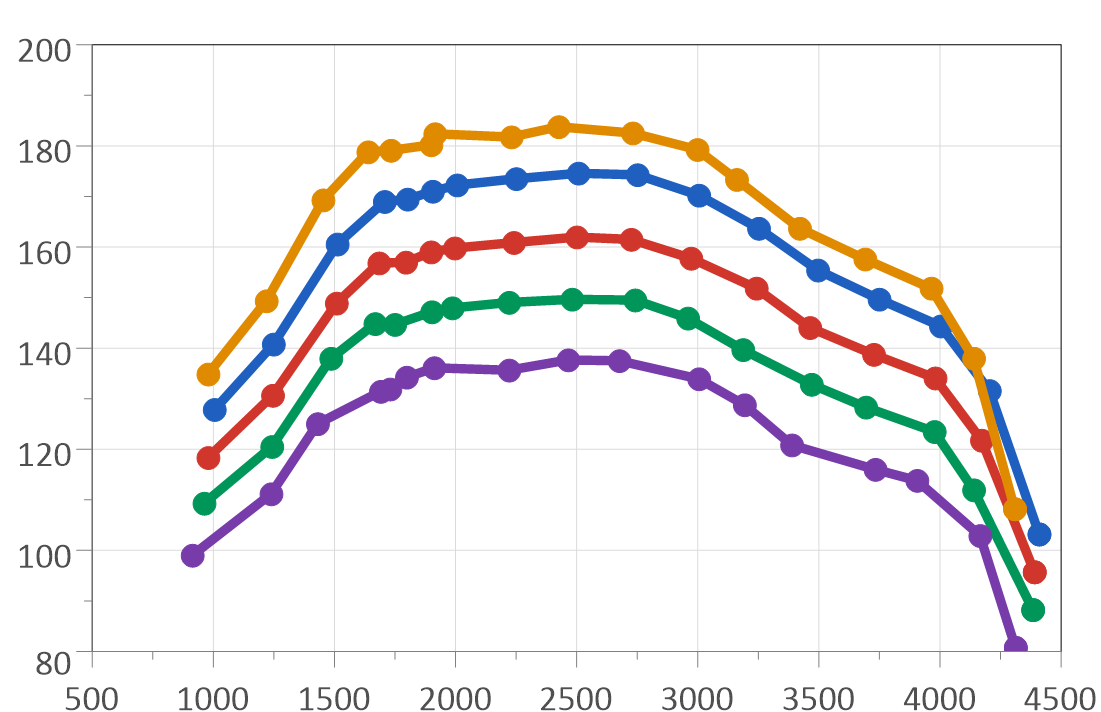
Plot channels by drag and drop, compare files, build maps and calculate new channels.
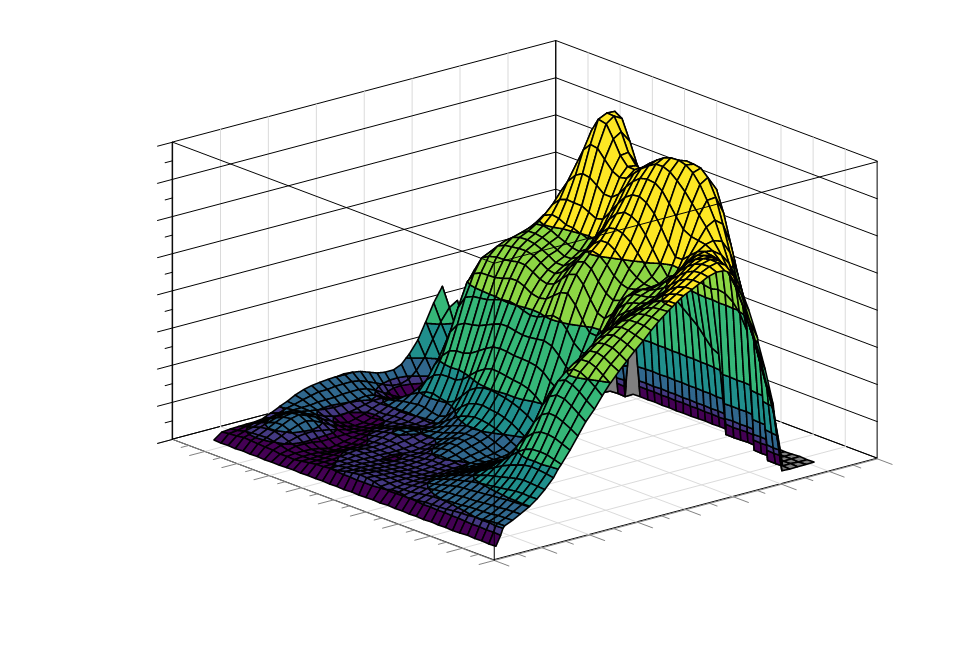
Read MDF4 files, decode BLF and ASC CAN logs with DBC or ARXML files, work with engine maps.
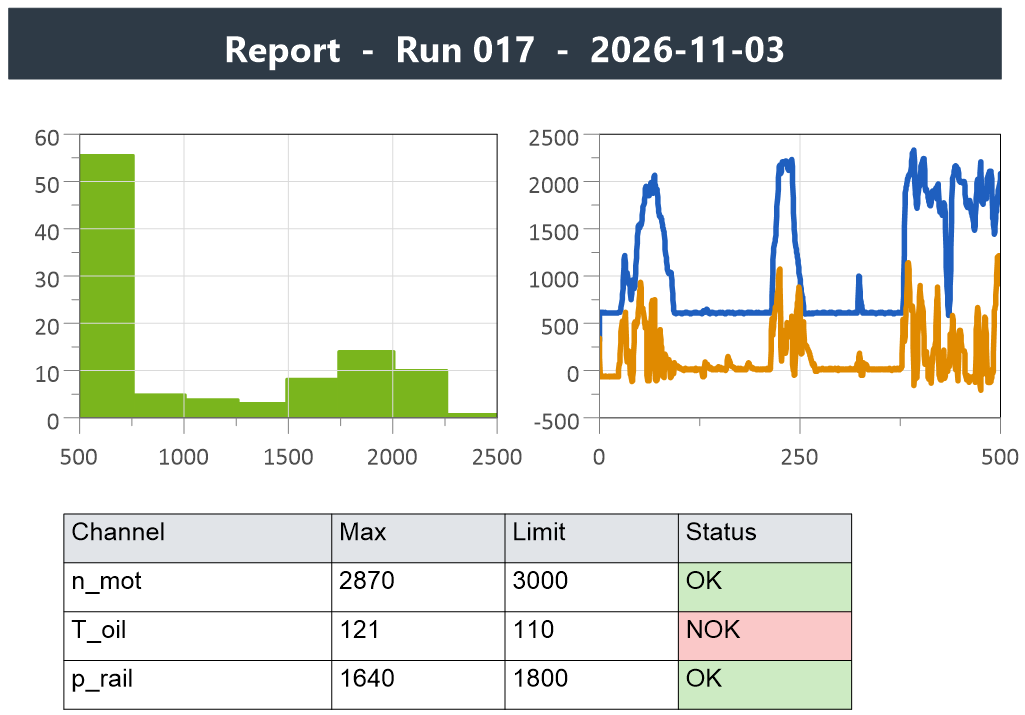
Report templates, PDF, Word, Excel and PowerPoint output, placeholders and conditional formatting.
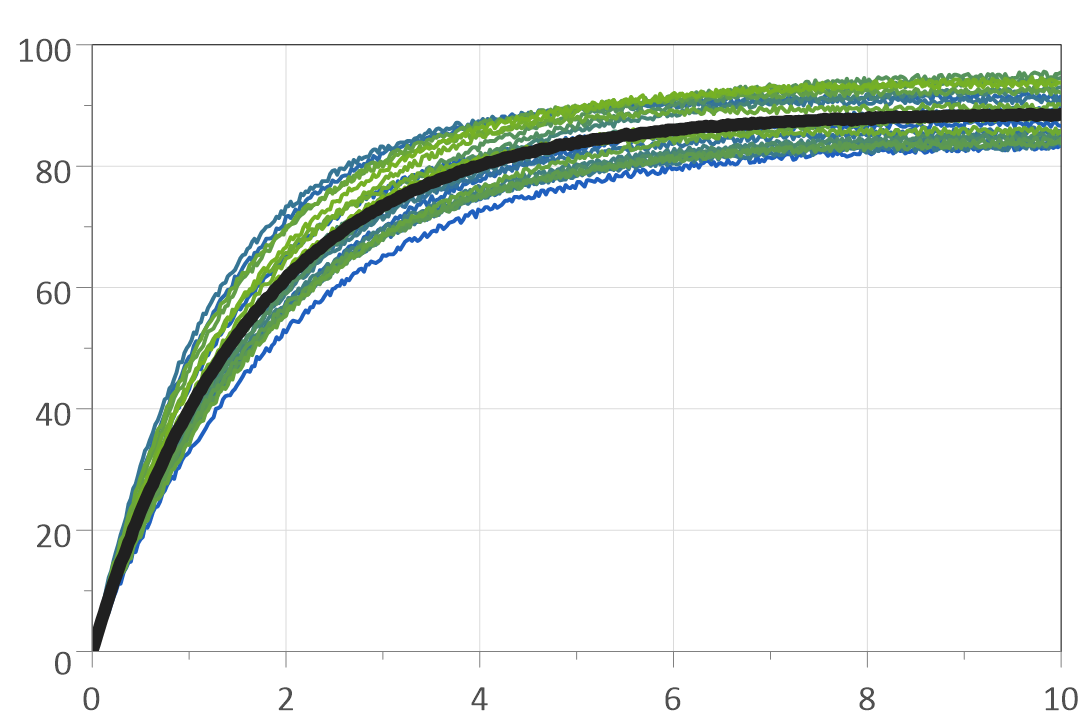
Run the same evaluation on hundreds of files, without or with programming.
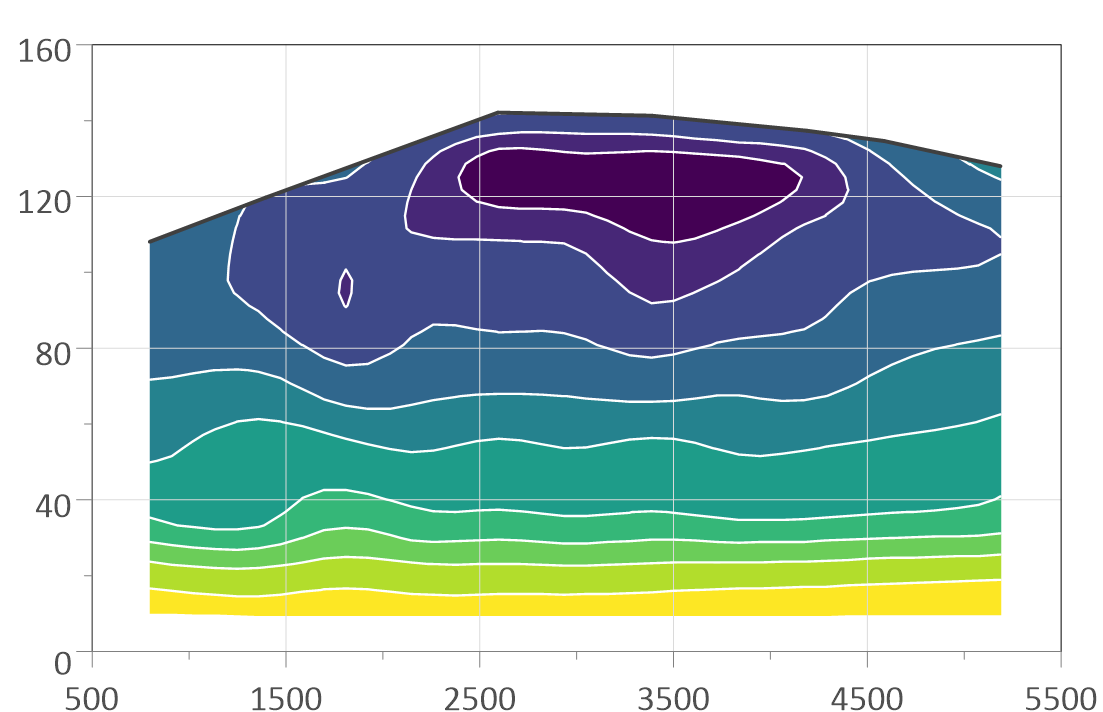
Contour maps, 3D surfaces, waterfall diagrams and rainflow counting.
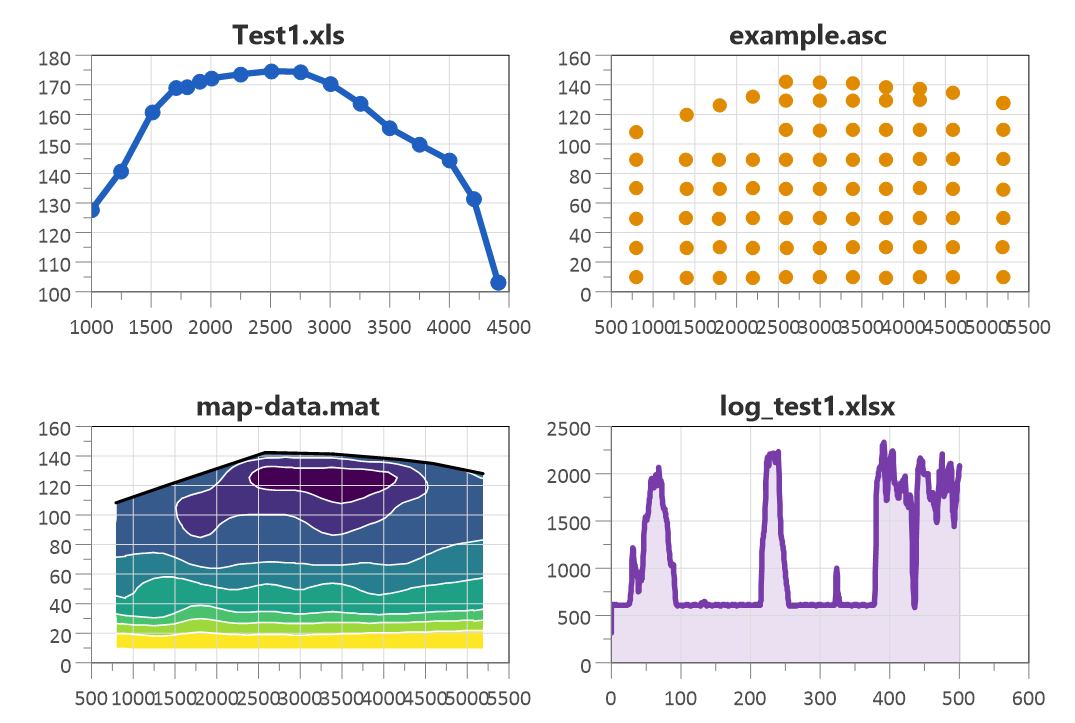
Excel, text, MATLAB, TDM, DIAdem, ASAM ODS, CONVERGE and many more file formats.
- Signal Processing & XY Filters
- Guides
- How do I smooth a noisy measurement signal with a moving average?
- How do I remove spikes and sensor dropouts from a signal?
- How do I smooth a signal without flattening its peaks?
- How do I low-pass filter a measurement signal?
- How do I calculate the frequency spectrum of a signal?
- How do I draw the upper and lower envelope of a signal?
- How do I find the peaks in a noisy signal automatically?
- How do I calculate the histogram of a measurement channel?
- How do I reduce the number of points of a long recording without changing its shape?
- How do I convert a sensor voltage into a physical value with a characteristic curve?
- How do I correct a sensor whose error changes over the measuring range?
- Quick answers
- How do I resample a signal with a fixed step width?
- How do I add points between the measured values?
- How do I remove outliers from a signal?
- How do I fit a smooth curve through scattered points?
- Which spline should I use if the data has steps?
- How do I turn an x/y curve into an evenly spaced time series?
- How do I cut out a time range of a signal?
- How do I keep only some of the points, by index?
- How do I convert units or add an offset?
- How do I calculate the derivative of a signal?
- How do I integrate a signal, for example power into energy?
- How do I integrate each engine cycle separately?
- How do I get the mean, maximum or minimum of every cycle?
- Which FFT window can I use?
- How do I calculate a cumulative histogram?
- How do I add a regression line or polynomial fit?
- How do I fit a line that goes through the origin?
- How do I draw the outline of an operating range?
- How do I extract a single bit from a status signal?
- Can I write my own filter function?
- Support questions
- Guides
- Peaks, Events & Limit Checks
- Guides
- Quick answers
- How do I count how often a signal crosses a threshold?
- How do I get a table with the start time of every event?
- How do I get the number of events and the longest and mean duration?
- How do I get the total time a signal spent above a limit?
- How do I label the peaks of a curve with their values?
- How do I find only the maxima, or only the minima?
- How do I compare the peaks or overshoots of several test runs?
- How do I check that a signal stays inside a tolerance band?
- How do I check the deviation from a setpoint?
- How do I make limit violations visible in a long recording?
- How do I show pass/fail results in color?
- Support questions
- Data Browser & Data Handling
- Guides
- How do I plot measurement channels without setting up every diagram by hand?
- How do I compare the same channel from several measurement files?
- How do I create an engine map from speed, torque and fuel consumption?
- How do I calculate a new channel, for example power, from measured channels?
- How do I get an overview of a test campaign with many measurement files?
- Quick answers
- How do I find a channel in a file with hundreds of channels?
- Can I look at a channel before I plot it?
- How do I plot several channels at once?
- Why does UniPlot sometimes create a new diagram when I drop a channel?
- How do I add channels to a stacked diagram?
- How do I replace the data of an existing curve?
- How do I sort the channel list?
- Can the axes be scaled automatically when I load a channel?
- How do I correct single measurement values?
- How do I synchronize files from two data loggers?
- How do I bring channels with different sampling rates onto one time base?
- How do I group operating points into classes?
- How do I convert all channels to SI units?
- How do I shorten long channel names, for example from MDF files?
- How do I update a whole document with the data of a new test?
- How can I open files with thousands of channels faster?
- How do I put measured values as a table on a page?
- How do I show the values at a cursor position in a table?
- Support questions
- Guides
- MDF, CAN & Calibration Data
- Guides
- Quick answers
- How do I import MDF 3.x files, for example from INCA?
- Can UniPlot read Vector ASC log files?
- Are CAN FD frames in ASC files supported?
- Can UniPlot decode multiplexed CAN messages?
- How do I import only some of the CAN messages?
- How do I import CAN data from one bus only?
- Which time channel belongs to an MDF or CAN signal?
- How do I get shorter channel names from MDF files?
- Are the trigger times of an MDF file kept?
- How do I convert MDF files to NC2?
- How do I import DCM calibration files?
- Can UniPlot read PaCo calibration files?
- How do I compare two versions of a map?
- How do I show a map as a filled contour plot?
- How do I show a map as a 3D surface?
- How do I get cross-sections of a map?
- How do I add the full load line (WOT) to a map?
- Can UniPlot draw a map from points that are not on a grid?
- How do I choose which isolines are drawn?
- How do I see where one consumption map is better than another?
- How do I turn a measured map into a calibration table?
- How do I calculate a channel from a map for a measurement?
- Support questions
- Reporting & Office Integration
- Guides
- How do I create hundreds of PDF reports from measurement files automatically?
- How do I build a report template that I can reuse for every test?
- How can my colleagues create a test report with a few clicks, without programming?
- How do I fill in operator, date and other header data automatically?
- How do I fill report placeholders from the data file without any dialog?
- How do I get measurement data and result tables into Excel?
- How do I highlight values outside the specification in a report table?
- Quick answers
- How do I send report pages to PowerPoint?
- Can I use our company PowerPoint template?
- How do I put report pages into a Word document?
- How do I stop copying diagrams into Office by hand?
- How do I show the file name in the page header?
- How do I put the company logo on every page?
- How do I create a header and footer for all pages?
- How do I show minimum, maximum and mean of a curve on the page?
- How do I rescale the diagrams of a report automatically?
- How do I export diagrams for publications?
- Can I add LaTeX formulas to a report?
- How do I fill the area between two curves?
- Can I create customer reports without Excel?
- How do I update a finished report with a new measurement file?
- How do I export many documents to PowerPoint at once?
- Support questions
- Guides
- Automation, Scripting & Batch Processing
- Guides
- Quick answers
- Can a workflow repeat steps and skip others?
- Can a test bench or another program start an evaluation?
- How do I test a Sequencer workflow step by step?
- How do I reuse a group of steps in several workflows?
- How does a script load a report template?
- How do I rescale the diagrams after loading data?
- How do I save each report under its own file name?
- Can I add my own functions to UniPlot?
- Can I control UniPlot from Python or other languages?
- Can a script download data from a web server?
- Can UniScript read from and write to a database?
- Can UniPlot read data from an ASAM ODS server?
- How do I share automations with my team?
- How do I log what a batch run did?
- How do I print or export reports from a script?
- How do I calculate formula channels in a script?
- How do I get the report as soon as the test has finished?
- How do I add my own step to a Sequencer workflow?
- Support questions
- Visualization & Specialized Analysis
- Guides
- Quick answers
- How do I draw a contour map with color filled areas?
- How do I draw curves on top of a contour map?
- How do I label the isolines?
- How do I show a map as a 3D surface?
- How do I switch between contour map and 3D surface?
- How do I show measured map points before interpolation?
- How do I fit a polynomial surface to map data?
- How do I turn a measured map into a calibration table?
- How do I create a compressor map?
- How do I create a pV diagram?
- How do I split crank angle data into 720° cycles?
- Can UniPlot calculate the heat release?
- How do I see how a vibration spectrum changes with speed?
- Can I draw polar diagrams?
- How do I show channels with different units in one diagram?
- How do I create a bar chart?
- How do I read exact values from a curve?
- How do I plot and compare fuel cell polarization curves?
- Can I display battery impedance (EIS) data?
- Support questions
- Import Formats & Interoperability
- Guides
- Quick answers
- Which file formats can UniPlot import?
- The file type I need is missing in the import dialog. What do I do?
- How do I import MATLAB .mat files?
- How do I import TDM and TDMS files from DIAdem or LabVIEW?
- How do I import DIAdem DAT files?
- How do I import FAMOS files?
- How do I import Dewesoft D7D files?
- How do I import Elsys TPC5 or TPS5 files?
- Can I import data from combustion analysis systems?
- How do I import ERG files from Siemens CATS?
- How do I import MORPHEE test results?
- How do I import ATFX files?
- How do I load data from an ASAM ODS server?
- How do I load data from FLEX-LAB?
- Can Simulink results be loaded into UniPlot automatically?
- Can UniPlot read netCDF files?
- How do I import a company-specific file format?
- Support questions