

How do I find the points where a signal overshoots or undershoots a limit?
Add the filter function find() to a copy of the curve. It keeps only the
points inside a value range, for example everything above 2000 1/min. Shown as
markers on top of the original signal, every violation is visible at a glance,
even in a recording of several hours.
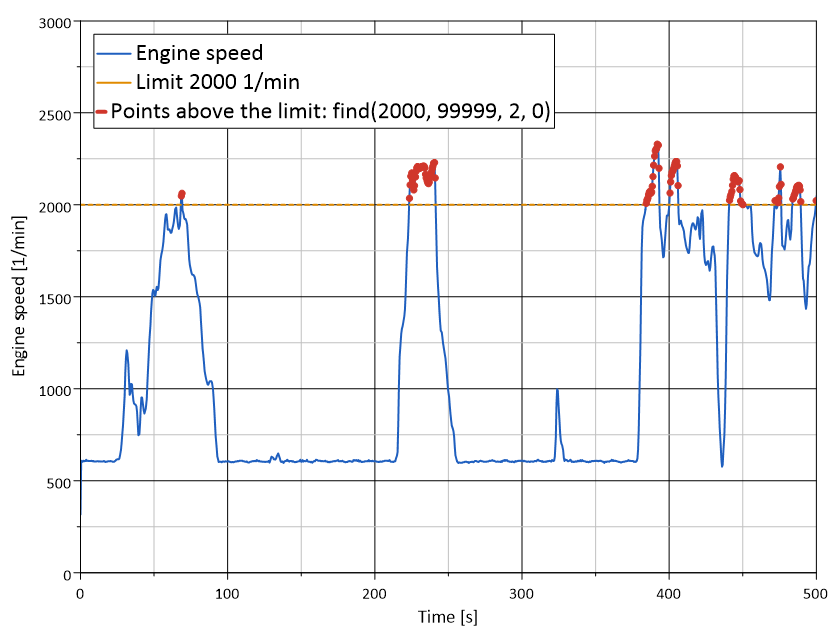
Engine speed from a test bench log: the red points were found with
find(2000, 99999, 2, 0).
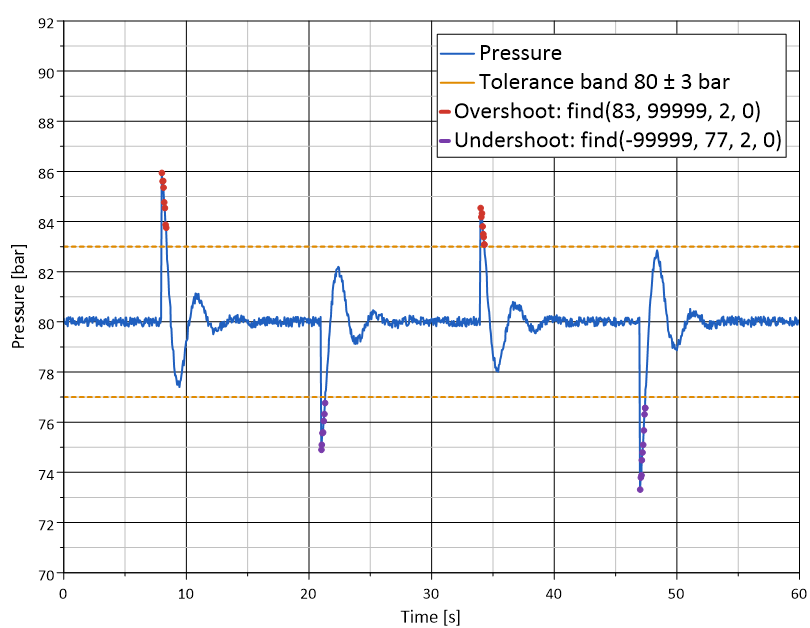
Tolerance band: two copies of the curve, one with find(83, 99999, 2, 0)
for the overshoots and one with find(-99999, 77, 2, 0) for the
undershoots (example data).
How it works
Copy the curve (Ctrl+C, Ctrl+V) and select the copy.
Right-click the copy, choose Edit Filter Functions…, add
findand click Edit.Set the range and the search direction:
find(min, max, Axis, Type). With Axis = 2 the y values are searched, with Type = 0 the limits are absolute values.Overshoot above 2000:
find(2000, 99999, 2, 0)Undershoot below 500:
find(-99999, 500, 2, 0)
Show the copy with markers only, so the found points appear on top of the original curve.
To draw the limit itself, right-click in the diagram and choose Threshold Value…. A threshold dataset can be a line or a range (band), see Data=>Threshold (Range).
Why it helps
No scrolling through long recordings: every violation is marked automatically.
The filter is stored in the curve. With the next measurement file the points are searched again.
The same filter string works in report templates and batch scripts.
Good to know
Type 1 divides the values by their maximum before the search, Type 2 scales them to the range 0 to 1. Then min and max are given between 0 and 1, for example
find(0.9, 1.0, 2, 1)finds everything above 90 % of the maximum. This is handy when runs have different setpoints.If no point is in the range, the result is a single point with the value 0.
Type 3 does not cut out points. It returns 1 inside the range and 0 outside. Followed by
event_duration()this gives the start and duration of every violation, see How do I measure how long a signal stays above a limit?.Axis = 1 searches the x values instead, for example a time window.