

How do I smooth a noisy measurement signal with a moving average?
Add the filter function smooth() to the curve. UniPlot replaces every point
by the mean of its neighbors: the noise disappears and the trend of the signal
becomes visible. The original data is not changed, and the filter is
recalculated automatically when the curve gets new data.
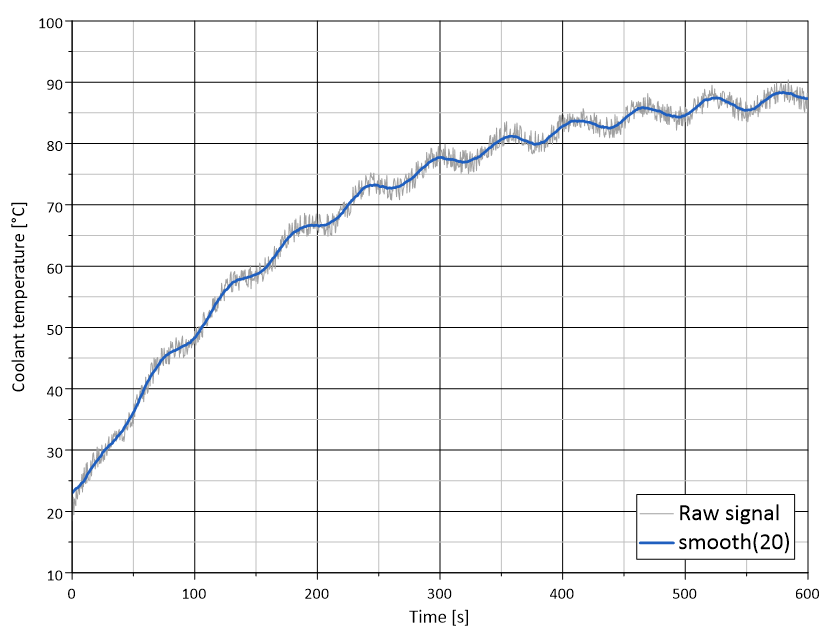
Coolant temperature during warm-up: raw signal (gray) and moving average
smooth(20) (blue).
How it works
Click the noisy curve in the diagram to select it.
Right-click the curve, choose Edit Filter Functions…, select
smoothin the list of available filters and click =>.Click Edit to set the window.
smooth(nNeighbor)averages each point with nNeighbor points on each side, so the window is2 * nNeighbor + 1points wide. Without a parameter, nNeighbor is 10.Click OK. The diagram now shows the smoothed curve.
To keep the raw signal visible, as in the picture above, copy the curve first (Ctrl+C, Ctrl+V) and add the filter to the copy.
In a script, the same filter is set with XYSetFilterFunctions:
XYSetFilterFunctions(hData, "smooth(20)");
Keeping real peaks
A moving average also flattens short events that are real. The optional second
parameter, the peak filter factor between 0 and 1, brings them back: UniPlot
compares the smoothed curve with the original and re-inserts every original
point whose deviation is larger than the factor times the largest deviation.
Example: smooth(20, 0.5).
Why it helps
The filter is stored in the dataset. Replace the data with the next test run and the curve is smoothed again, without any extra work.
The raw data stays untouched. Change or remove the filter at any time.
The same filter string works interactively, in report templates and in batch scripts.
Good to know
If the sampling rate differs from file to file, use
smooth_time(rsTimeWindow). rsTimeWindow is the total width of the window in x units, for example seconds, and UniPlot calculates the number of points for each file.For single spikes and sensor dropouts a moving median (
smooth_median) works better, because one extreme value cannot pull the result away.If the height and width of peaks matter, use the Savitzky-Golay filter (
smooth_golay).Filters can be chained, for example
smooth(10);peaks(5, 0, 1). Each filter works on the result of the previous one.