

Visualization & Specialized Analysis
Engine maps, cycle-resolved combustion data, durability loads: some data needs more than an x/y line plot. UniPlot draws 3D datasets as contour maps or 3D surfaces, stacks cycles in waterfall diagrams and has dedicated import types for compressor maps and pV diagrams. This page collects the most common questions about these diagram types and the analyses behind them.
Guides
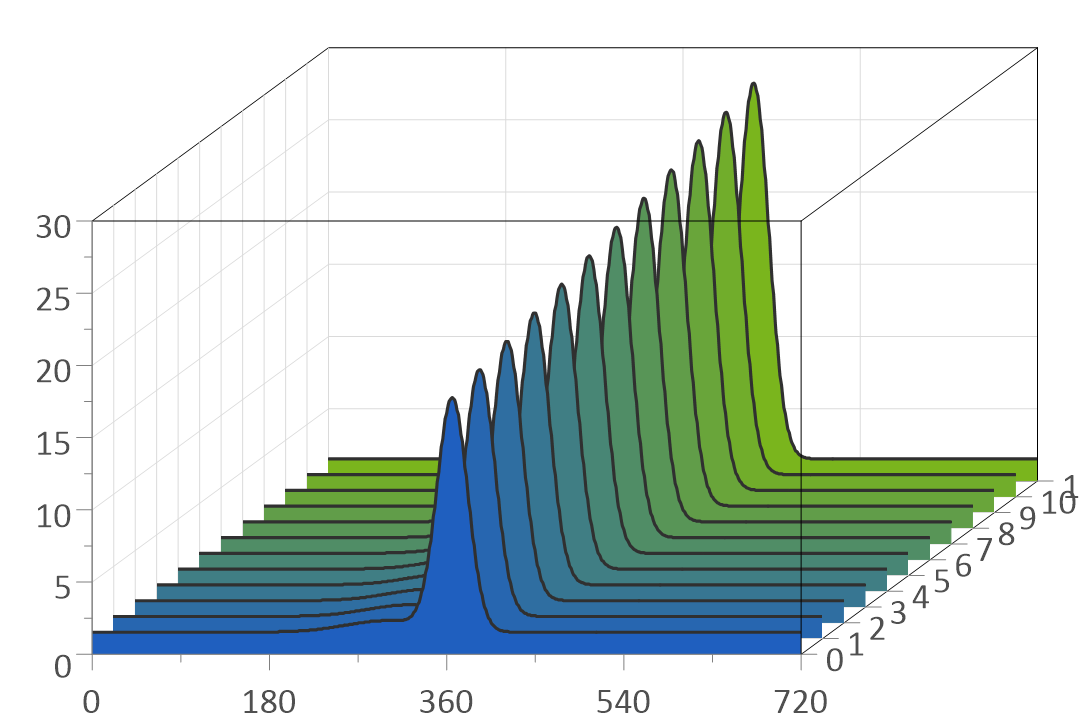
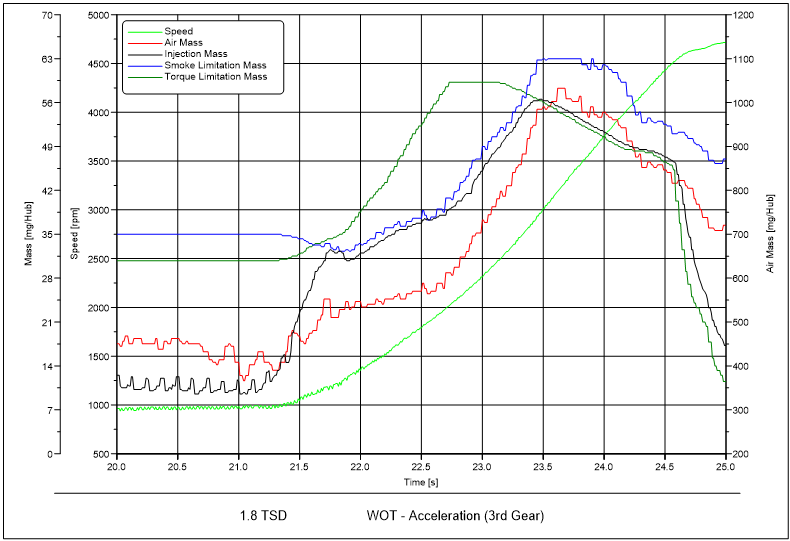
Show many cycles, runs or spectra in one diagram.
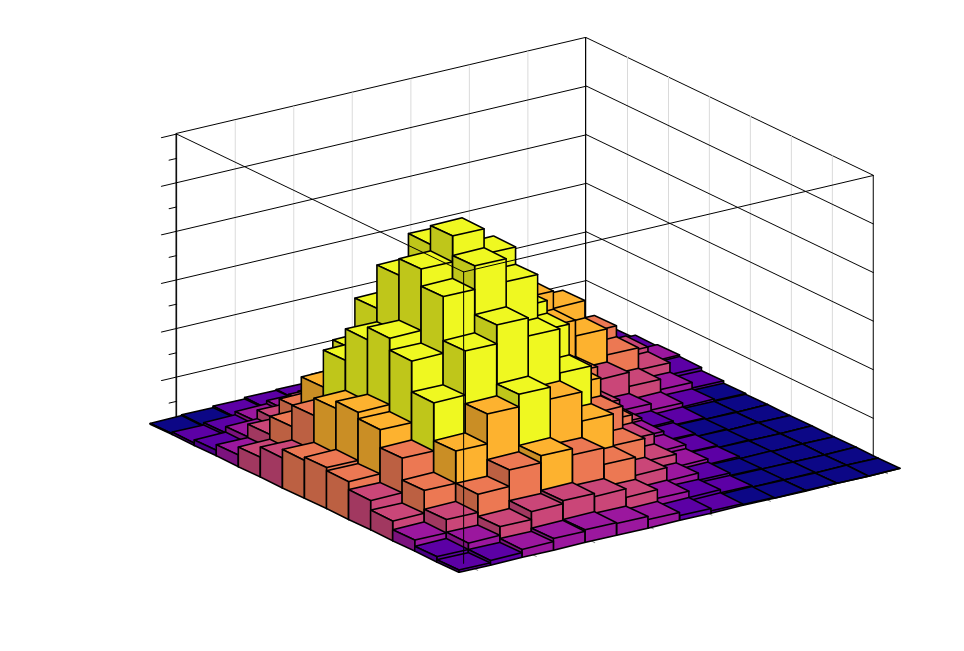
Count load cycles for durability analysis.
Quick answers
How do I draw a contour map with color filled areas?
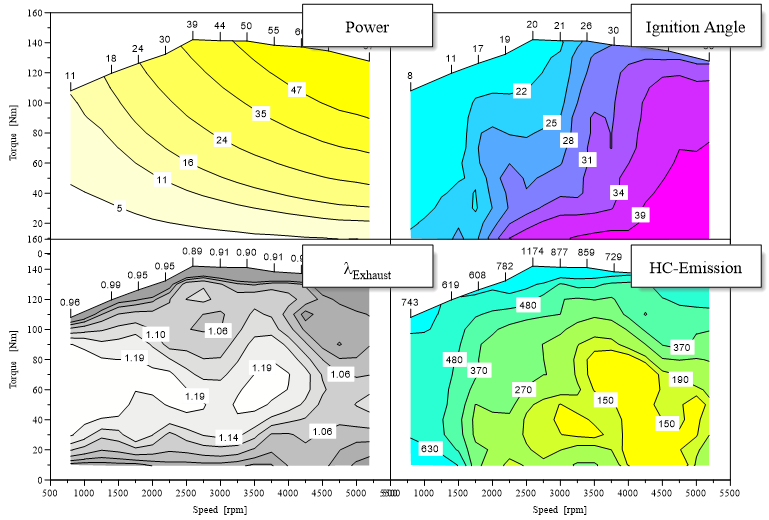
Load the map as a 3D dataset (x, y, z channels, see How do I create an engine map from speed, torque and fuel consumption?). In Data=>3D-Dataset=>Color Map select Color Filling between Isolines. The isoline values and fill colors are set on the same tab. To add a matching color scale, right-click an isoline and choose 3D Color Legend. See also How do I colour an X/Y/Z map with a colour map, change the isolines and add a colour legend?.
How do I draw curves on top of a contour map?
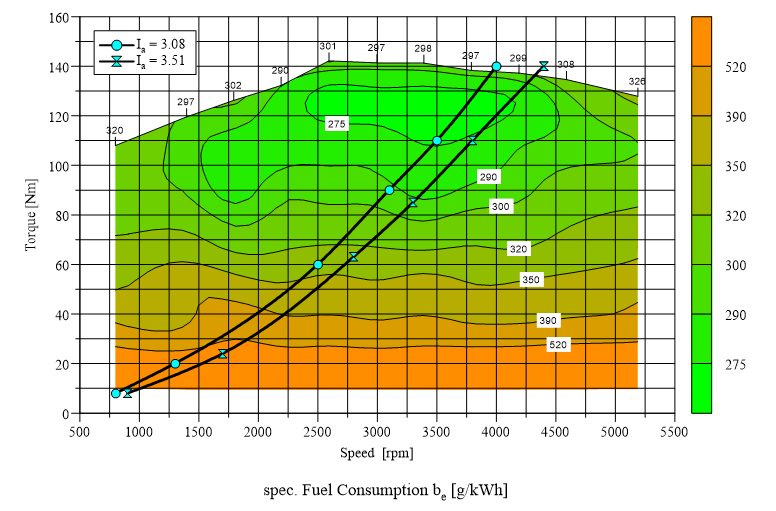
In the 2D display a diagram shows all of its datasets, 2D curves as well as 3D maps. Load the full load curve or the operating points of a driving cycle into the same diagram as the map, and they are drawn on top of the contour lines.
How do I label the isolines?
Data=>3D-Dataset=>Isoline sets the number of decimals and the label
format. Labels can be horizontal or follow the line, drawn in the line
color, in a box or with a white background. To get exactly the levels you
need, enter them in Data=>3D-Dataset=>Color Map: 100,10,130 creates
the isolines 100, 110, 120 and 130. See also How do I improve isoline labels, and can I keep user-defined labels after a data exchange?.
How do I show a map as a 3D surface?
Select the diagram and choose Diagram=>Display as 3D Plot (Ctrl+3). The viewing angle is set in Diagram=>3D View, the surface style (grid, solid color or color gradient) in Data=>3D-Dataset=>3D Surface / Bars. To combine several 3D datasets in one plot, for example a fuel consumption surface colored by NOx, right-click the diagram and choose U3D: Create 3D-Plot.
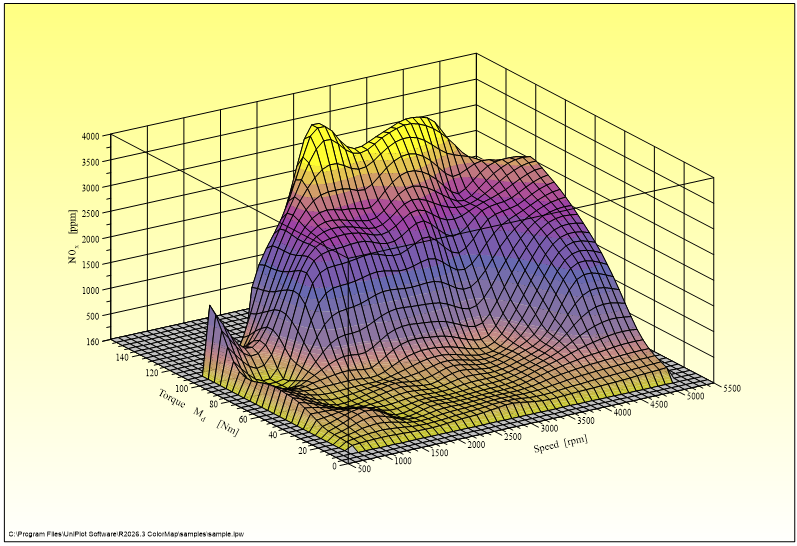
How do I switch between contour map and 3D surface?
Ctrl+2 shows the diagram as 2D plot (contour map), Ctrl+3 as 3D plot (surface). The 2D plot shows all datasets of the diagram, the 3D plot only the 3D datasets.
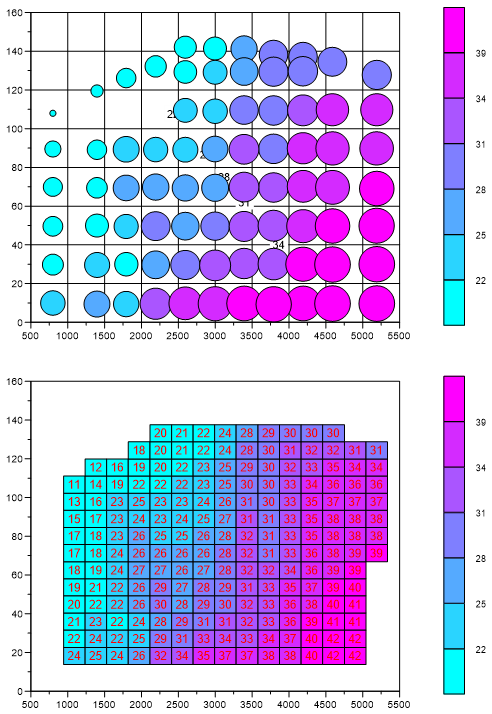
How do I show measured map points before interpolation?
Data=>3D-Dataset=>Scatter Plot draws the measured points as symbols in the 2D diagram. Each point can be labeled with its z-value or with its line number in the data file. As a bubble plot, symbol size and color represent the z-value: check Bubble Plot on the same tab and click Options…. See also How do I create a scatter or bubble plot with a third channel as colour or size?.
How do I fit a polynomial surface to map data?
Right-click an isoline and choose 3D Polynomial Fit (or Data=>More Data Functions => Create a 3D Polynomial Fit). UniPlot calculates a least squares polynomial surface up to third order for the 3D dataset. The result is added to the diagram as a new 3D dataset.
How do I turn a measured map into a calibration table?
The Map-Calculator add-in calculates a matrix with freely chosen, non-equidistant breakpoints from a measured 3D dataset. The matrix can be saved as INCA-CSV, DAMOS or Magneti-Marelli-CSV file, or copied to the clipboard and pasted into Excel. See Map Calculator. See also How do I fit, remove or define the hull (envelope) of a 3D map?.
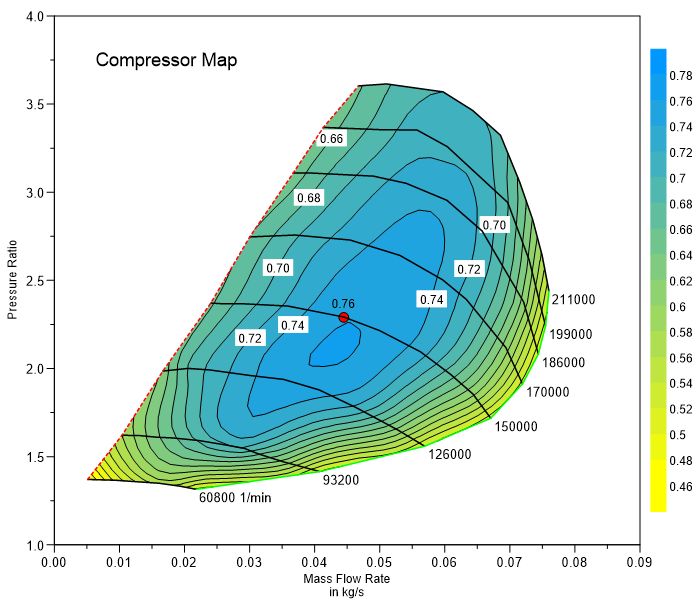
How do I create a compressor map?
In File=>Import Data choose the type 3D: Compressor-Map: x,y,z,speed and select four channels, for example air flow, pressure ratio, efficiency and wheel speed. UniPlot creates the efficiency map and the lines of constant speed, labeled with the rounded speed value.
How do I create a pV diagram?
In File=>Import Data choose the type 2D: PV-diagram: (CA) Crank Angle is used to split cycles. Volume is plotted on x, pressure on y, and the crank angle channel splits the data into one curve per cycle. See pV diagram import. See also How do I create a p-V diagram from indicating data?.
How do I split crank angle data into 720° cycles?
Use the import type 2D: x/y Cycle in File=>Import Data and enter
cycle start and length, for example 0 and 720 °CA. If the file has a cycle
number channel, the type 2D: x/y/Cycle-Index creates one curve per
cycle. Per-cycle values are calculated with the filters
integrate_cycle() and cycle_value(), and many cycles are easiest to
compare in a waterfall diagram.
See also How do I plot cycles (hysteresis, charge/discharge, P-V cycles) as one coloured curve per cycle?.
Can UniPlot calculate the heat release?
For AVL IFILE data, yes: the IFILE import can calculate the heat release rate according to Hohenberg while loading the file (Tools=>IFile Configuration (Heat Release Rate)). See Import of IFILE Data Files. For other data sources there is no ready-made heat release function. See also How do I import indicating (IFILE / INDI) files, and what if the import fails?.
How do I see how a vibration spectrum changes with speed?
Calculate the spectrum of each measurement with the filter
fft_spectrum() (see How do I calculate the frequency spectrum of a signal?) and show
the spectra in a waterfall diagram.
Can I draw polar diagrams?
Yes. Switch the diagram with Diagram=>Display as Polar Plot. In a polar
diagram the x values are the angle and the y values the radius.
Diagram=>Layout=>Polar sets the angle origin and direction, the inner
radius and the spokes. In a script, a diagram is switched with
LayerSetDiagramType(hLayer, LAYERVIEW_POLAR). See also
How do I create a polar diagram or a spider web (radar) diagram?.
How do I show channels with different units in one diagram?
Use a stacked diagram (Diagram=>Create Stacked Diagram): several y-axes on the left and right share one grid and one x-axis, and their scaling always matches the grid lines. See Stacked diagrams with multiple y axes.
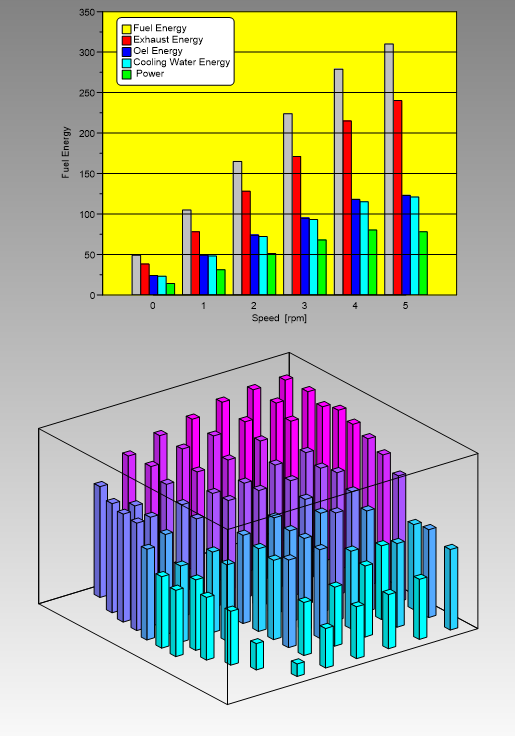
How do I create a bar chart?
Any curve can be drawn as bars. Fill or hatch, vertical or horizontal
orientation and the bar width (in centimeters or percent of the diagram
width) are set in the Bar Style dialog box. In a script:
XYSetProps(hData, "bar='1' curve='0'"). See also
How do I draw bars or histogram bars in front of the grid?.
How do I read exact values from a curve?
Select the curve and press F5 to show the data cursor. With Ctrl held down cursor 1 is moved, otherwise cursor 2; values between the two cursors can be calculated. The cursor values can be added to the page as a table. See Data=>Data Cursor. See also How do I add cursors and a table with the values at the cursor positions?.
How do I plot and compare fuel cell polarization curves?
UniPlot has no fuel cell specific module, but the usual steps are standard
functions: plot cell voltage over current density as a 2D curve, smooth it
if needed and overlay several stacks or test runs (see
How do I compare the same channel from several measurement files?). Stable load points
in a stepped test are found with find_plateau(), see
How do I evaluate the load steps of a fuel cell test automatically?.
Can I display battery impedance (EIS) data?
Yes, with standard diagrams. For a Nyquist plot load the real part on x and
the imaginary part on y, and flip the sign with the filter
scale(-1, 0). For a Bode plot show magnitude and phase over frequency
with a logarithmic x-axis (Diagram=>x-Axis=>Parameters). UniPlot
does not include equivalent circuit fitting; that would have to be written
in UniScript.
Support questions
Error messages, settings and other practical problems in this area are answered in the FAQ: Diagrams, Axes and 3D Maps.