

Reporting & Office Integration
A UniPlot report is a template document with diagrams, tables, logos and text placeholders. A short script or a menu command fills it with a measurement file, and the result goes to PDF, Word, PowerPoint or Excel. The layout is designed once; every new test produces the same report with new data.
Guides
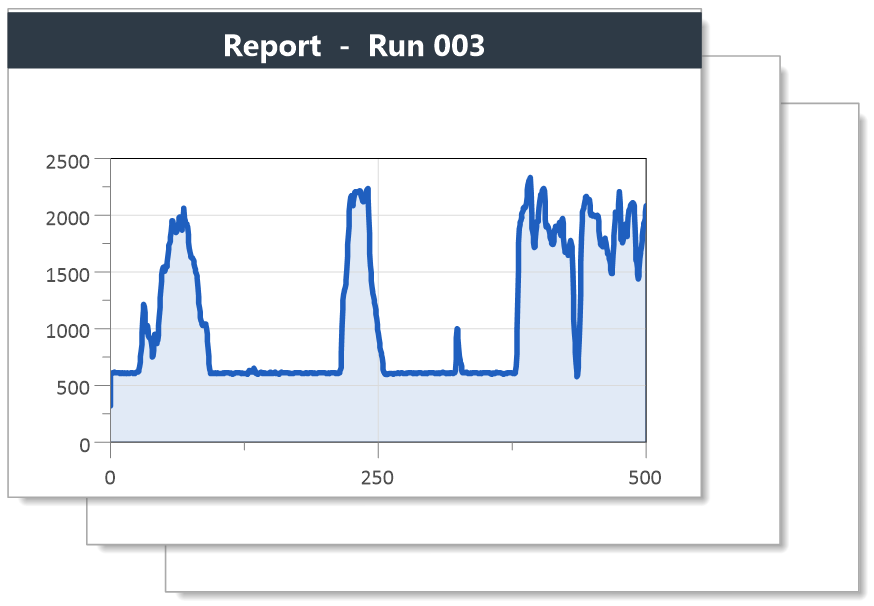
One PDF per measurement file, created by a script.
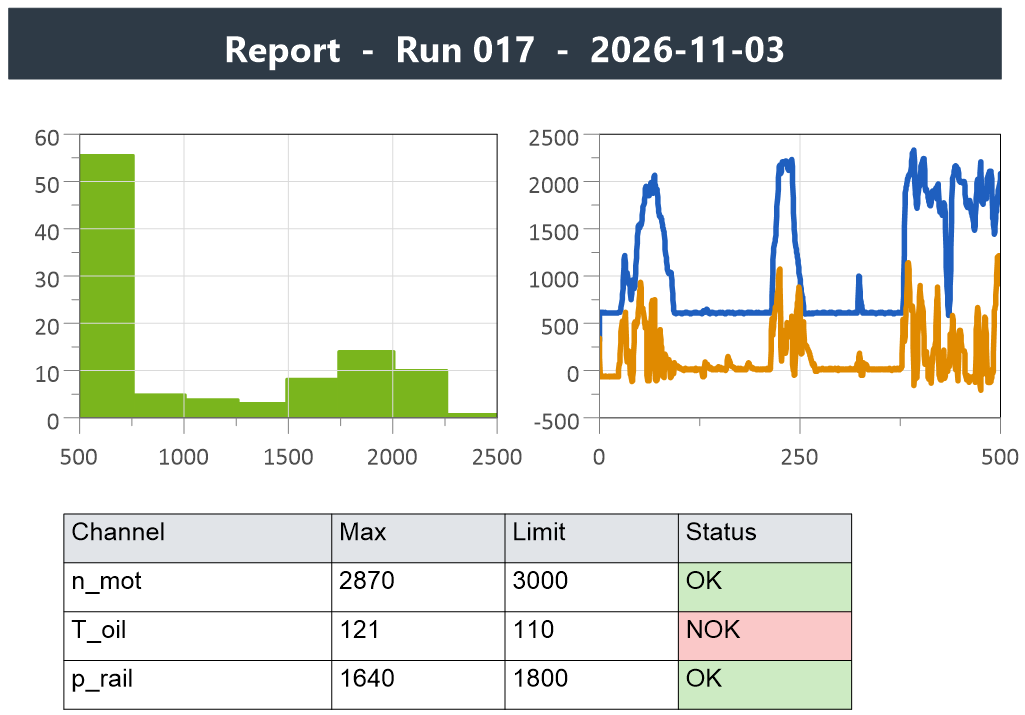
Design the report once, reuse it for every test.
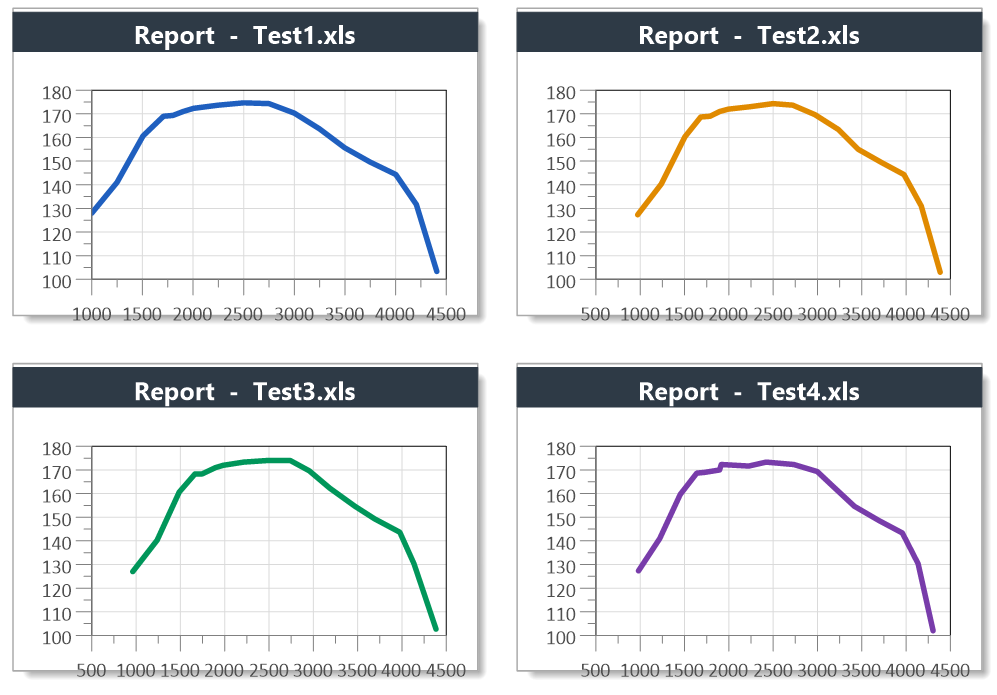
Choose the report, choose the file, done.
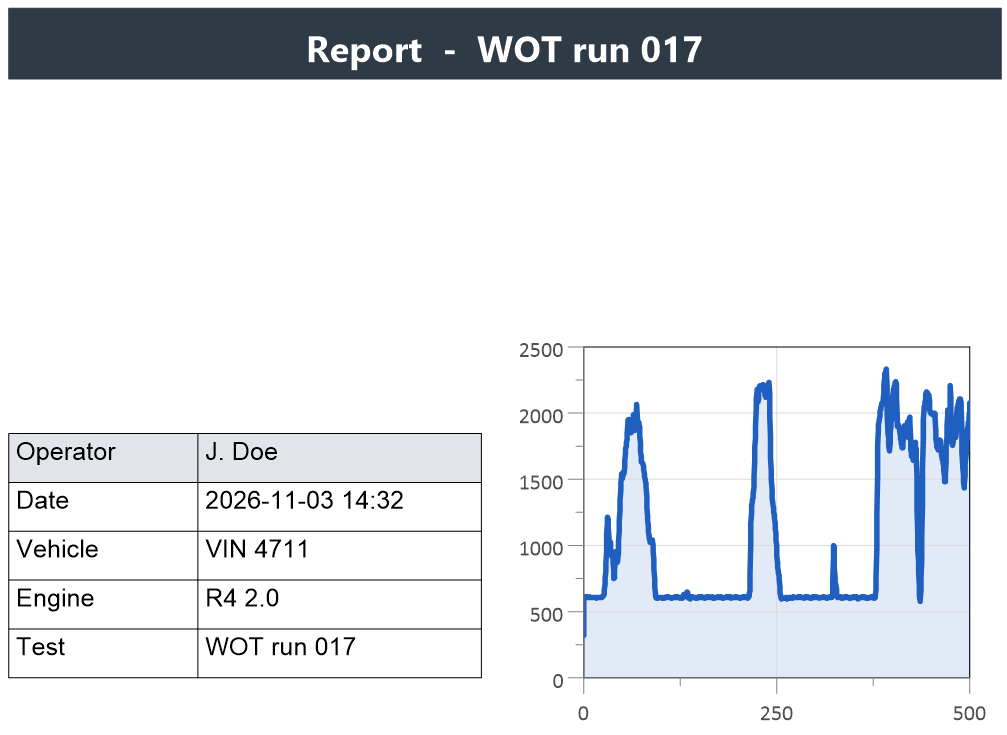
Operator, date and test data filled in automatically.
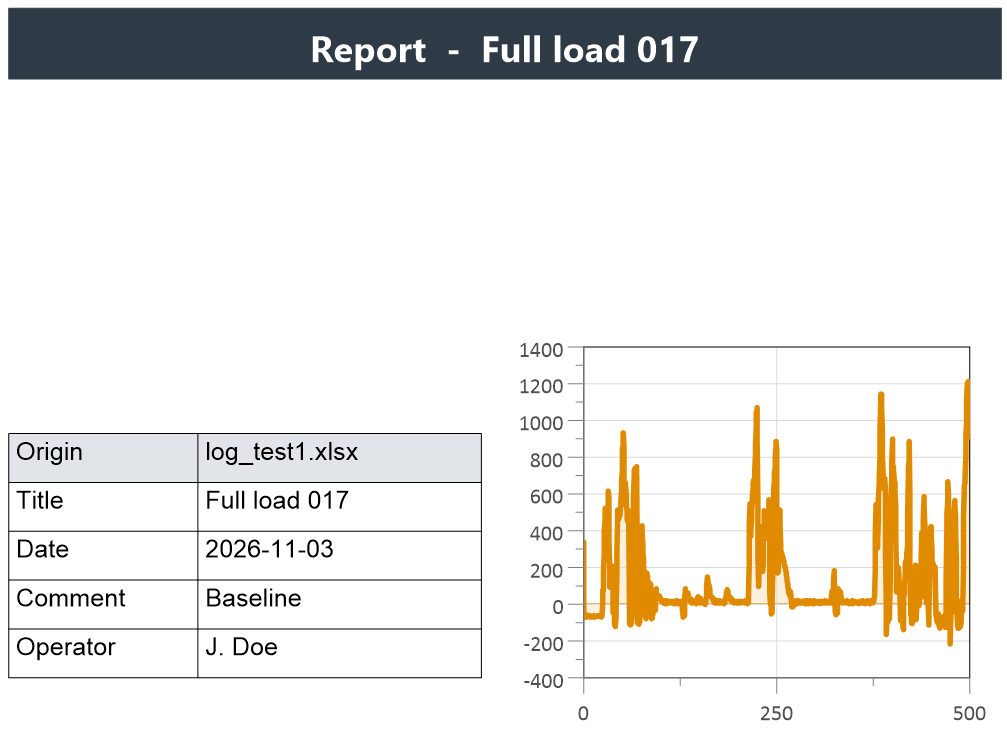
Fill header texts from the file for unattended runs.
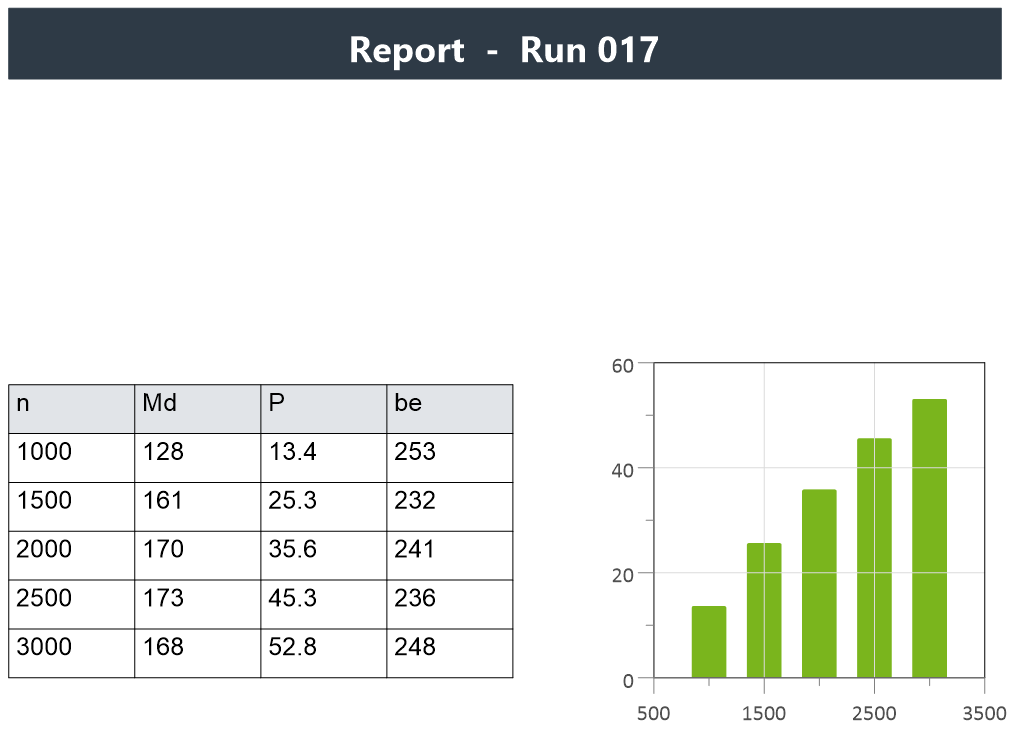
Fill Excel templates with header data and channels.
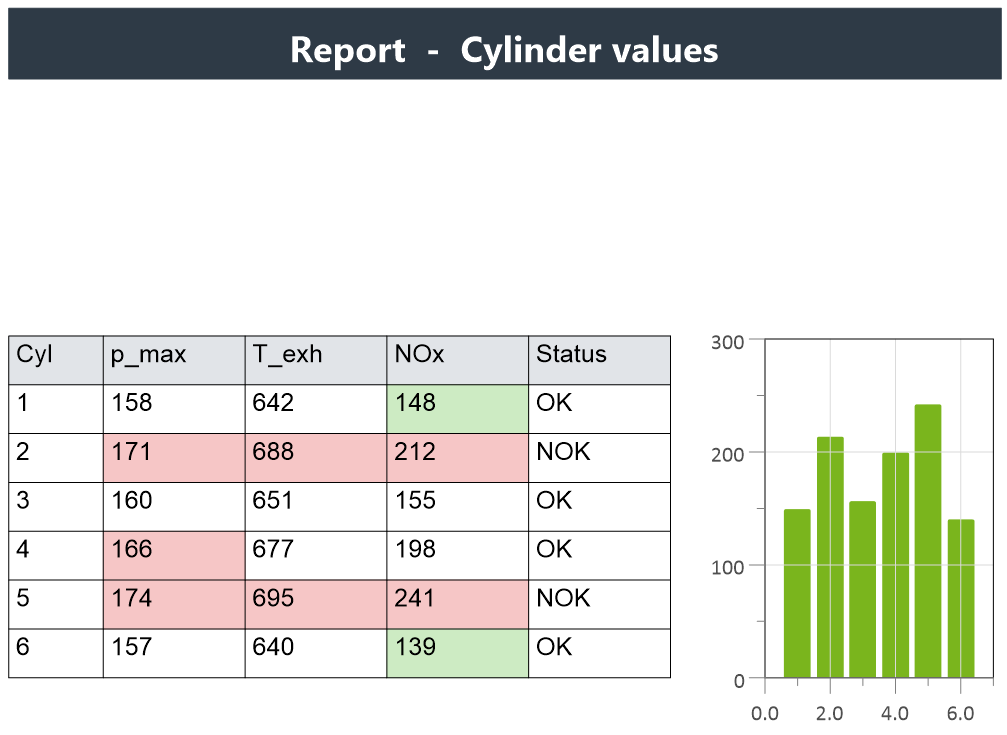
Color the table cells that are out of specification.
- How do I create hundreds of PDF reports from measurement files automatically?
- How do I build a report template that I can reuse for every test?
- How can my colleagues create a test report with a few clicks, without programming?
- How do I fill in operator, date and other header data automatically?
- How do I fill report placeholders from the data file without any dialog?
- How do I get measurement data and result tables into Excel?
- How do I highlight values outside the specification in a report table?
Quick answers
How do I send report pages to PowerPoint?
Right-click outside the page or on the page tab and choose Export=>Send To PowerPoint. The selected pages are inserted as EMF vector graphics, one slide per page. The slides are marked with their UniPlot pages: after a data exchange, Export=>Update Active PowerPoint Document updates them. See File=>Send to PowerPoint. See also How does the PowerPoint export work and which options should I choose?.
Can I use our company PowerPoint template?
Yes. Enable Use PowerPoint Template in the export dialog and select a
.ppt or .pptx file. The last slide of the template receives the
UniPlot page: a text object UniPlot-Frame on that slide sets its
position and size, and a text object UniPlot-Page-Title is replaced by
the page title. An example is UniPlot_landscape.ppt in the
UniPlot/Template directory. See also
The export to PowerPoint (especially with a PowerPoint template) suddenly fails with an error such as “Presentation.NewWindow: Object does not exist”. Is this fixed? and Can I place two UniPlot pages side by side on one PowerPoint slide (two UniPlot-Frame objects)? Can a page stay linked?.
How do I put report pages into a Word document?
Right-click outside the page or on the page tab and choose Export=>Send To Word. The selected pages are inserted as EMF vector graphics. Options rotate landscape pages or create the Word document in landscape format. See File=>Send to Word.
How do I stop copying diagrams into Office by hand?
Send all selected pages to Word or PowerPoint in one step, fill Excel templates with How do I get measurement data and result tables into Excel?, or create PDF files from a script, see How do I create hundreds of PDF reports from measurement files automatically?. PowerPoint pages can be updated after the data has changed.
How do I show the file name in the page header?
Put the field function @f{documentname} into a text object. It shows
the file name of the UniPlot document; with a parameter such as
@f{documentname(name.ext)} only parts of the name are shown. For the
name of the measurement file, use the placeholder $Origin$ in a report
template. See also How can I list the names of all data files used in the document or on a page in a text field?.
How do I put the company logo on every page?
Place the logo on a separate page and use it as a master page: right-click outside the page and choose Select Master Page. The elements of a background or foreground page are shown on every page it is assigned to, but can only be edited on the master page itself. See Page=>Select Master Page.
How do I show minimum, maximum and mean of a curve on the page?
Data=>More Data Functions=>Compute statistic writes statistic values of
a curve as text objects. The field function
@f{xystatistic(DatasetName)} shows minimum, maximum, mean, mean
deviation, variance and standard deviation and is updated with
Edit=>Update Fields. See also How can I fill a table with minimum and maximum values of channels without UniScript?.
How do I rescale the diagrams of a report automatically?
Call auto_ScaleAxes() in the automation script after loading the data.
x and y axes can be scaled separately. In the template, set a fixed
scaling where the data range is always the same. See also
How do I set axis limits, tick spacing and number format by script?.
How do I export diagrams for publications?
File=>Export=>Save As WMF or BMP saves pages as vector graphics (EMF, EMF+, WMF) or bitmaps. File=>Export=>PDF Export creates PDF files. See File=>Metafile/Bitmap-Export. See also How can I change the size of an exported image?.
Can I add LaTeX formulas to a report?
Yes, with Edit=>Insert LaTeX Formula. Type the formula, for example
$$\int_{0}^{\infty} x^2 e^{-x^2} dx = \frac{\sqrt{\pi}}{4}$$. It is
inserted as a 600 dpi bitmap. The LaTeX installation is set under
Tools=>LaTeX Formula Configuration. See
Edit=>Insert LaTeX Formula. See also Can I use LaTeX formulas in axis titles?.
How do I fill the area between two curves?
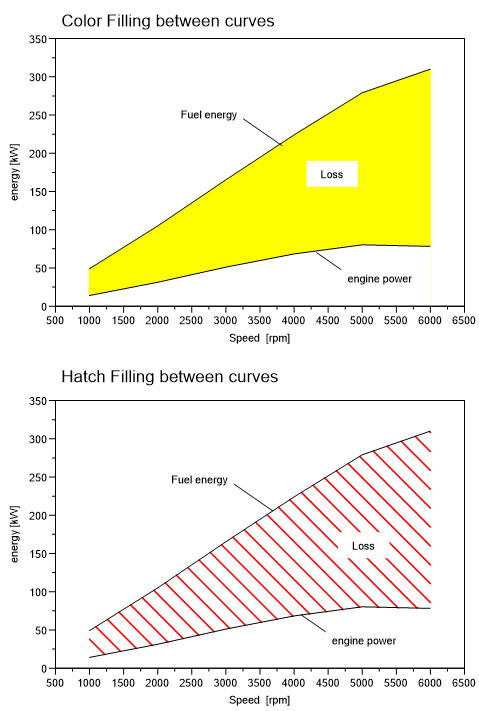
Data=>More Data Functions=>Fill area between 2 2D-datasets with hatch fills the area between two curves, for example the losses between fuel energy and engine power. See also Why do vertical lines appear when I fill the area under a curve or between a curve and a threshold?.
Can I create customer reports without Excel?
Yes. Diagrams, tables, logos and text are all part of the UniPlot page, and
File=>Export=>PDF Export creates the PDF file. With
Create bookmark with tree structure, the page names become a chapter
structure, for example Engine.Data1. Bookmarks are only created when
the PDF is made with Ghostscript. See also How can I create a PDF file from UniPlot?.
How do I update a finished report with a new measurement file?
Choose Data=>Data Exchange (Document) and select the new file for each data file used in the document. All datasets imported from these files get the new data, and their filters are recalculated. See Data=>Data Exchange (Document). See also Data exchange gives an error about missing channels, or old data stays in diagrams whose channel is missing. What should I check? and Title or placeholder text in my template is not updated after Data Exchange. What is wrong?.
How do I export many documents to PowerPoint at once?
Use PageSendToPowerPoint(hvPage, ssTemplate, ssSaveName, bAppend, bClose)
in a loop over the documents. With bAppend = 1 the pages are added to an
existing PowerPoint file. The manual page PageSendToPowerPoint
contains a complete example that converts selected IPW/IPZ files into
.pptx files. See also How can I export many .ipz files to PowerPoint in one run?.
Support questions
Error messages, settings and other practical problems in this area are answered in the FAQ: Export, Printing and Microsoft Office and Documents, Templates and Data Exchange.