

How do I reduce the number of points of a long recording without changing its shape?
Add the filter function simplify(nTolerance) to the curve. UniPlot uses
the Douglas-Peucker algorithm: points that lie almost on a straight line
between their neighbors are removed, corners and peaks are kept. A curve with
thousands of points often needs only a few hundred to look the same.
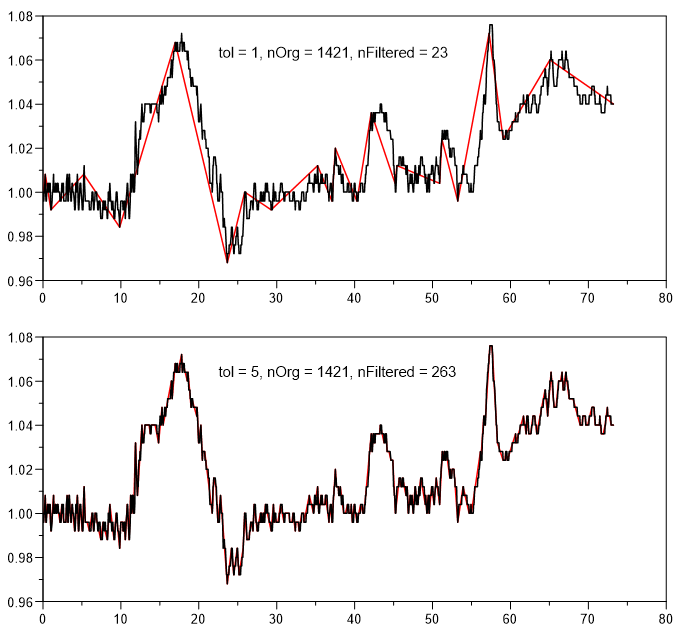
The same curve (black, 1421 points) simplified with tolerance 1 (red, 23 points) and tolerance 5 (red, 263 points).
How it works
Right-click the curve, choose Edit Filter Functions…, select
simplifyand click =>.Click Edit and set nTolerance between 1 and 30. 1 gives the strongest reduction, each step halves the allowed deviation, 30 is practically lossless. The default is 5.
Click OK and compare the result with the original.
In a script:
XYSetFilterFunctions(hData, "simplify(5)");
Making the document smaller
simplify alone only changes what is drawn; the original points are still
stored in the document. To make the file smaller, chain
remove_original_data_points():
simplify(5);remove_original_data_points()
Then close the document with File=>Close (Save Compact), which writes the file without the removed data.
Why it helps
Documents with long recordings become much smaller.
Diagrams with many curves are redrawn faster.
The shape of the curve, including peaks, stays visible.
Good to know
The tolerance is relative to the x and y range of the curve, so the same value works for signals with very different units.
After
remove_original_data_points()the filter cannot be changed until the original data is loaded again. A data exchange still works.Use the simplified curve for display, not for calculations that need every sample, for example an FFT.