

How do I draw the upper and lower envelope of a signal?
Add the filter function boundary(type, width) to a copy of the curve.
UniPlot sorts the points by x, divides the x range into classes and follows
the outermost points from class to class. With type = 2 you get the upper
and the lower envelope in one curve.
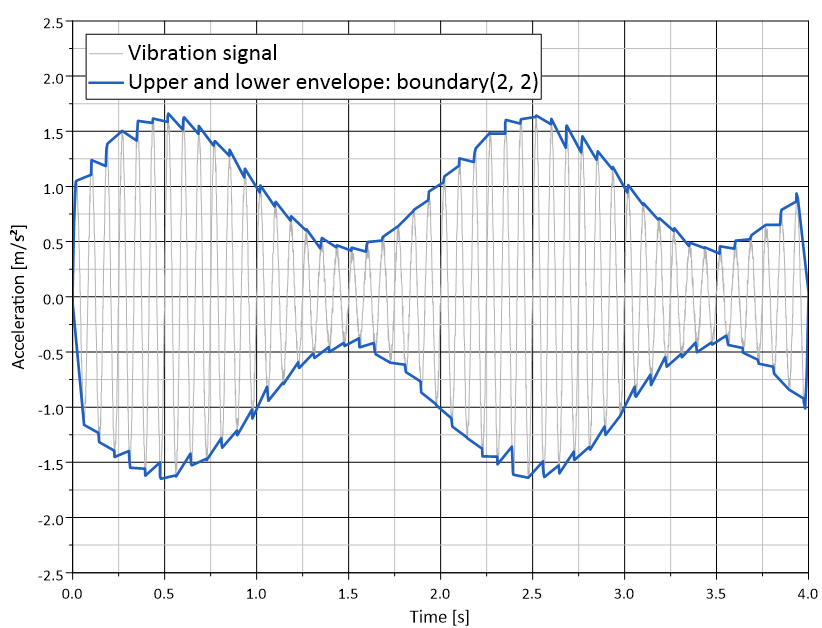
Vibration signal (gray) with upper and lower envelope calculated with
boundary(2, 2) (blue).
How it works
Copy the curve (Ctrl+C, Ctrl+V), so the signal and its envelope are both visible.
Right-click the copy, choose Edit Filter Functions…, select
boundaryand click =>.Click Edit and set the two parameters:
type: 0 upper envelope, 1 lower envelope, 2 both.
width: class width in percent of the x range, 1 to 100. Smaller values follow the signal more closely.
Click OK.
In a script:
XYSetFilterFunctions(hData, "boundary(2, 2)");
Why it helps
Shows the amplitude of an oscillating signal at a glance, without drawing anything by hand.
Works for time signals and for point clouds, for example torque over speed.
The envelope is recalculated when the curve gets new data.
Good to know
Always give type explicitly; then the result does not depend on default values.
The class width controls the shape: with a large width the envelope only follows the slow trend, with a small width it follows single oscillations.
For the outline of a point cloud, for example the measured points of an engine map,
convex_hull()gives a closed polygon around all points.
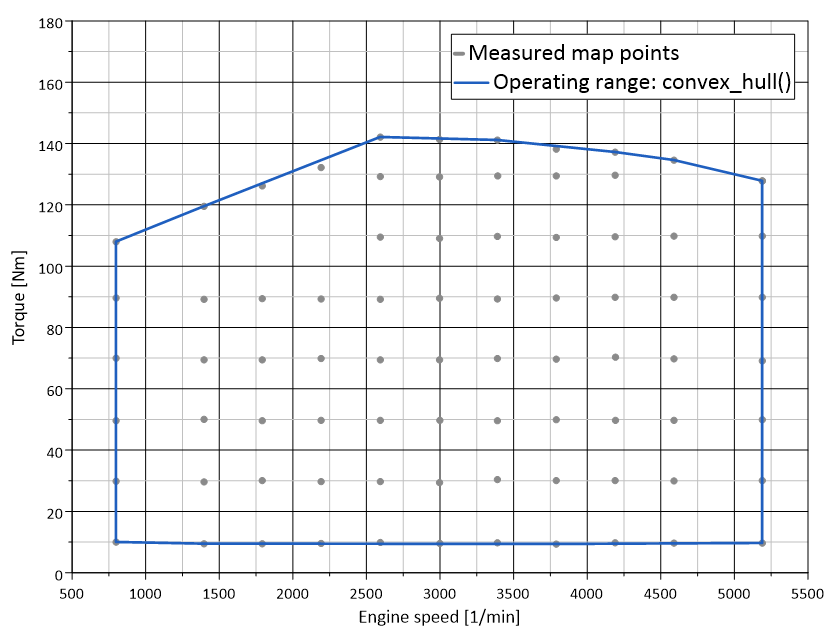
Measured map points and their outline calculated with convex_hull().