

How do I find the steady-state phases (plateaus) in a measurement?
Use Data=>More Data Functions… > Find Plateaus…. UniPlot looks for sections where the signal stays within a tolerance for a minimum time and creates a new curve, the plateau signal: every plateau gets a number (1, 2, 3, …), the ramps between them are 0. With Plateaus (min/max…)… in the same list you then calculate a value for each plateau, for example the mean of another channel.
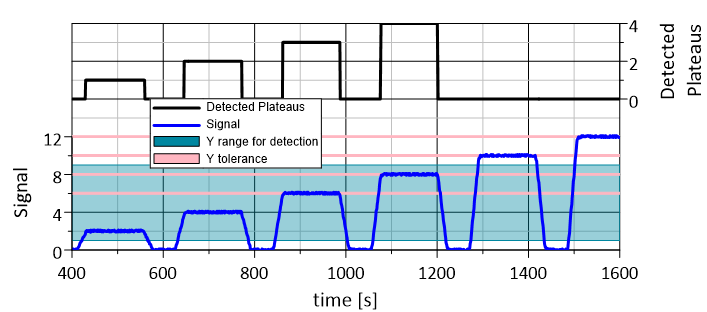
Plateaus detected in a step signal. Only plateaus inside the value range and the time limits are numbered.
How it works
Select the curve that contains the steps, for example a load or speed setpoint.
Choose Data=>More Data Functions… > Find Plateaus… (or right-click the curve > New Dataset > Find Plateaus…) and set the conditions:
Y-Tolerance (dy_tol): the signal must stay within +/- this value.
Y-range for detection (y_min_threshold, y_max_threshold): only plateaus in this value range are detected.
Min and Max plateau duration (dx_min, dx_max): minimum and maximum duration of a plateau, in x units (usually seconds).
UniPlot adds the plateau signal as a new curve.
To evaluate the plateaus, click the plateau curve, hold Shift and click the curve to analyze. Choose Data=>More Data Functions… > Plateaus (min/max…)… (or right-click > Multiple Datasets > Compute on Plateaus…). Select the Plateau signal, the Signal and the Computation, for example
mean,min,maxorstandarddeviation. With Create table dataset you get one value per plateau, ready for a report table.
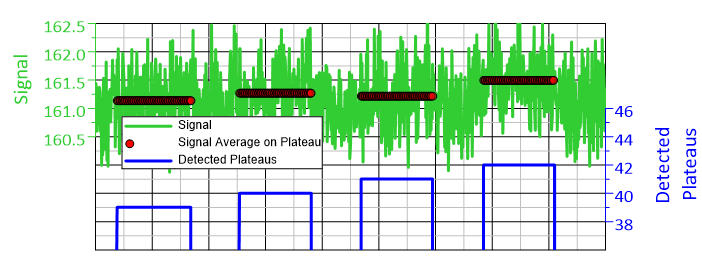
A signal (green) averaged on each plateau (blue) with Plateaus Computation.
In scripts, the UniScript functions find_plateau and plateau_computation do the same.
Why it helps
Steady-state points are found by the same rules in every test, not by eye.
The numbered plateaus are a ready-made grouping key for statistics per operating point.
One value per plateau goes straight into a report table.
Good to know
A plateau never contains missing values. A sensor dropout ends the plateau.
Besides mean, min and max, the Computation list offers the first and the last value (
start,end) and their difference (end-start), the median, variance, standard deviation and the number of points (npoints) of each plateau.All computations use the y values of the Signal. For the duration of each plateau, choose
end-startwith a curve that has the time as y values (time over time) as Signal.The plateau signal and the Signal must have the same number of points, for example channels of the same measurement raster.
Both commands are new in UniPlot R2026.3.