How do I measure how long a signal stays above a limit?
Chain two filter functions: find(min, max, 2, 3) turns the signal into 1
(inside the range) and 0 (outside), and event_duration() creates one point
per event: x is the start of the event, y is its duration. Turned into a
table, this gives a timestamped list of every limit violation.
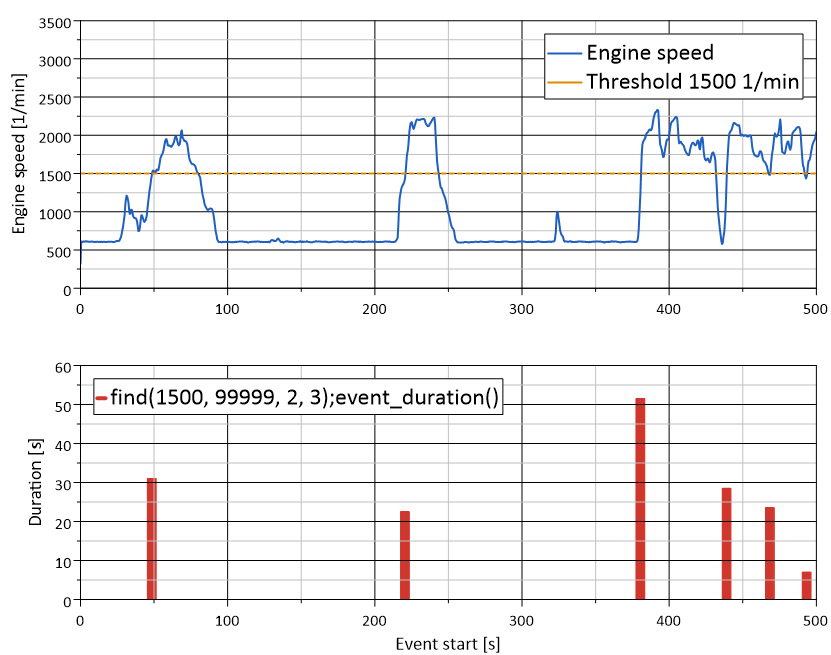
Top: engine speed with the threshold 1500 1/min. Bottom: every period above
the threshold, calculated with find(1500, 99999, 2, 3);event_duration().
How it works
Copy the curve (Ctrl+C, Ctrl+V) and select the copy.
Right-click the copy, choose Edit Filter Functions… and add
findwith Axis = 2 and Type = 3, for examplefind(1500, 99999, 2, 3)for “above 1500”.Add
event_durationas the second filter. The copy now has one point per event.Right-click the curve and choose Text Object=>2D-Table to get a table with start time and duration of every event.
Optionally add conditional formatting to the table, so events that are too long are colored, see How do I highlight values outside the specification in a report table?.
Why it helps
An exact list of events with start time and duration instead of a manual count with cursors.
The filters are recalculated when the curve gets new data, so the table is correct for every new test run.
Works for any condition that
find()can express: speed, temperature, pressure, voltage.
Good to know
The duration is given in the unit of the x channel, usually seconds.
An event that is still active at the end of the recording is counted up to the last point.
The number of points of the result is the number of events.
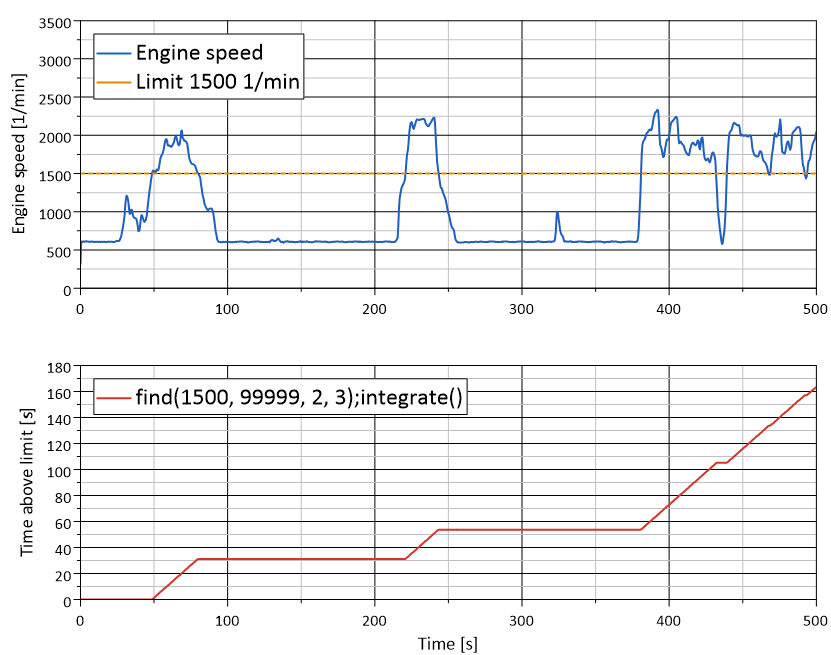
To get the total time above the limit instead of each event, use
find(1500, 99999, 2, 3);integrate(): the integral of the 0/1 signal grows by the time spent above the limit, its last value is the total.